| Map Gallery Slide Show |
Image 43 of 75 |
Los Angeles
Basin Demographics |
|
|
|
.jpg)
|
|
|
 |
 |
 |
|
|
|
|
|
|
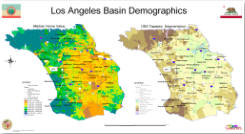
Top Row: Demographics and Tapestry -
CLICK TO DOWNLOAD |
|
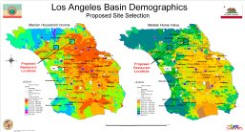
Second Row: Demographics and Tapestry with Proposed Site Selection
-
CLICK TO DOWNLOAD |
|
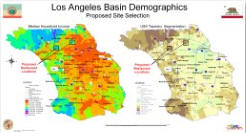
Third Row: Large Versions of Demographics and Tapestry -
CLICK TO DOWNLOAD |
|
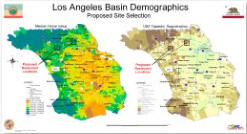
Bottom Row: Large Versions of Demographics & Tapestry with
Proposed Site Selection -
CLICK TO DOWNLOAD |
|
|
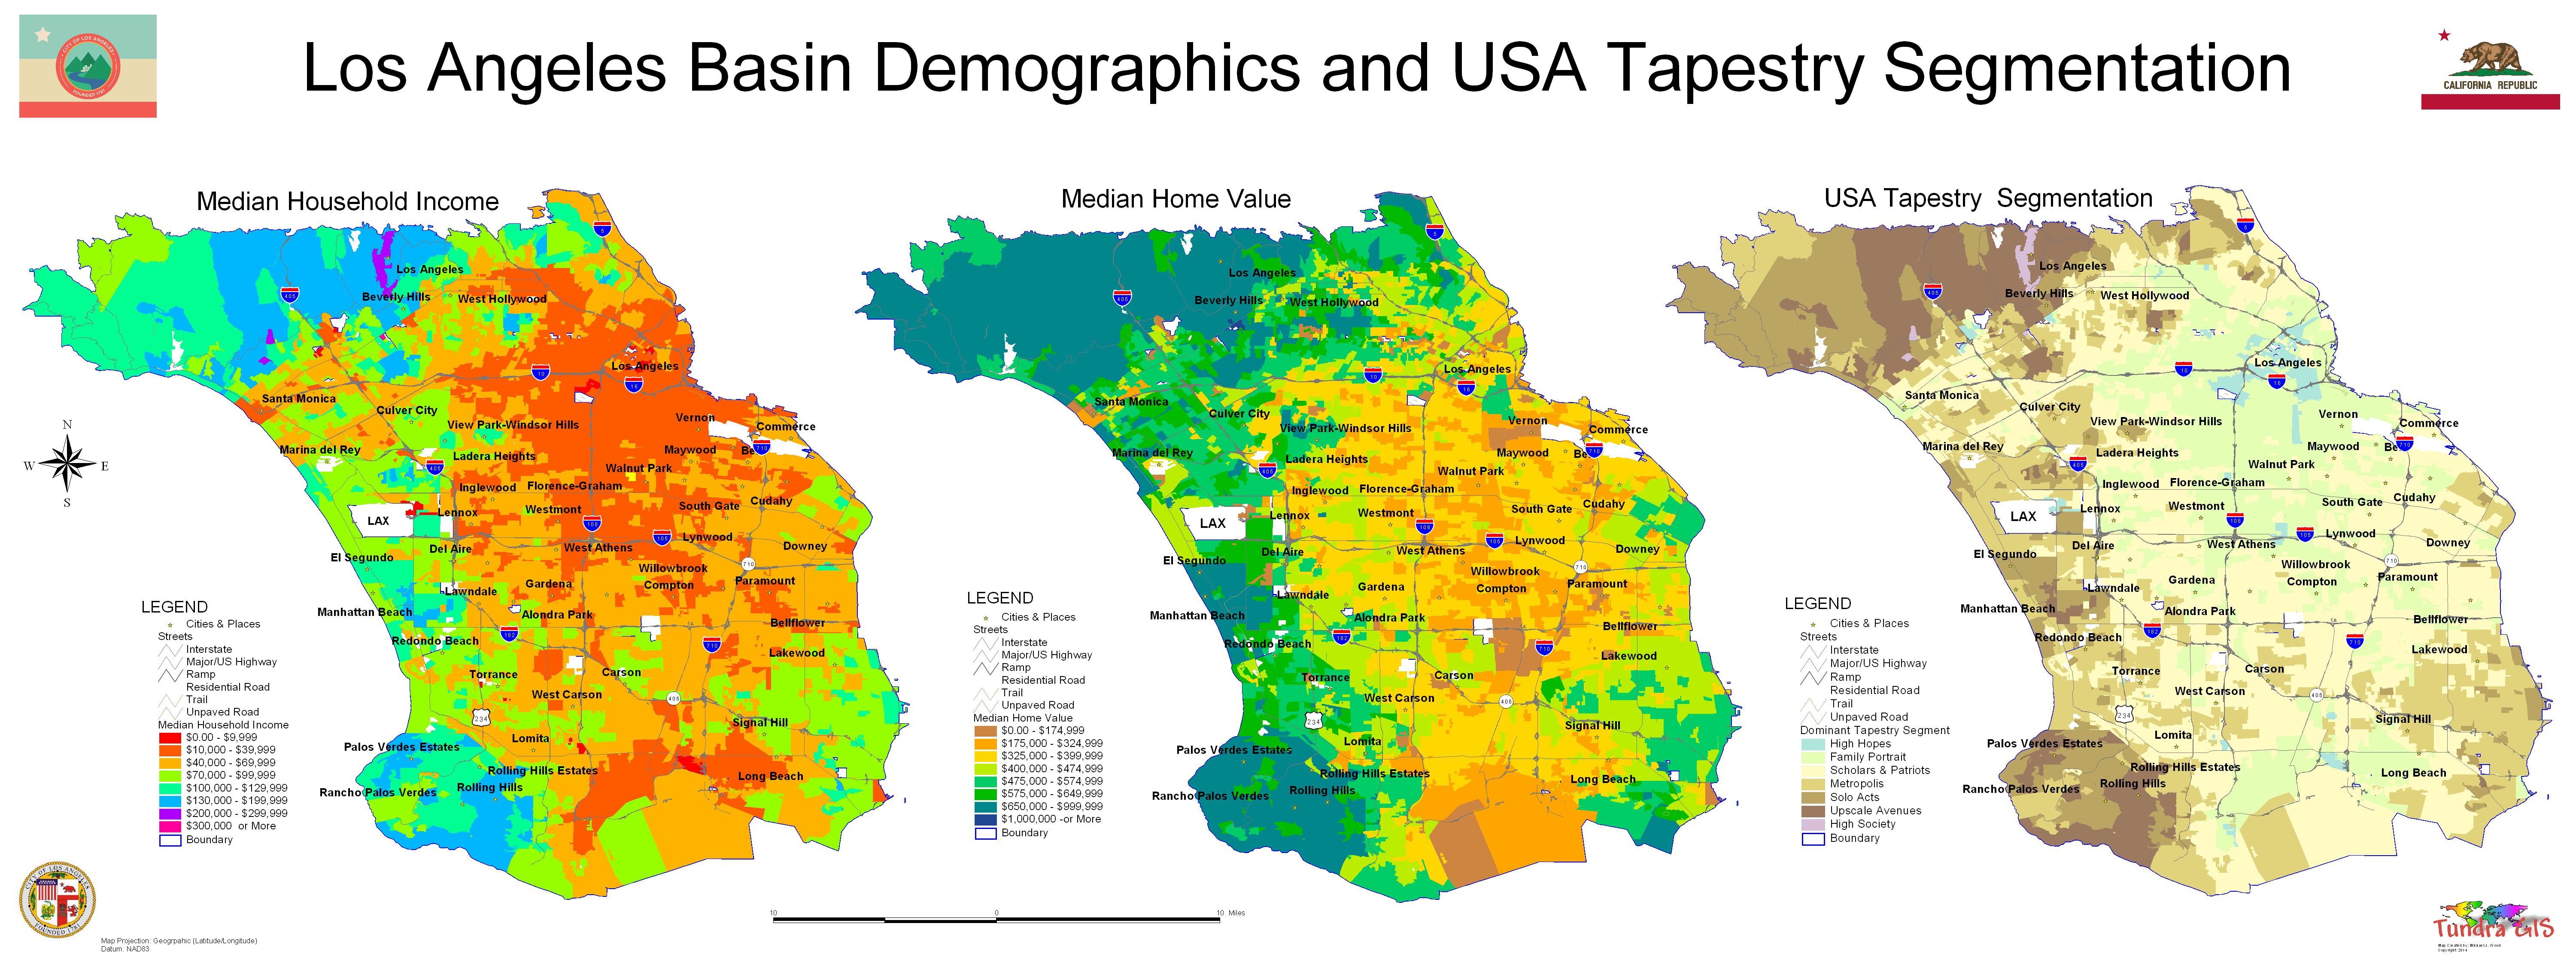
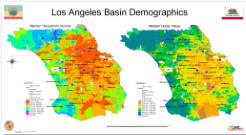
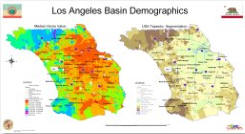
| Los Angeles Basin Demographics -
2014 |
This map series shows the demographics and community
tapestry for the Los Angeles Basin in Southern California. The
purpose of the maps was to assist in the site selection of a proposed
new upscale restaurant. The demographic data includes Median
Household income (MHI), Median Home Value (MHV) and the ESRI Community
Tapestry Data. The map was created
using ArcView 3.3.
|
|
CLICK HERE TO DOWNLOAD (ALL MAPS) |
|
< back |
up ^ |
next > |